Скачать презентацию
Идет загрузка презентации. Пожалуйста, подождите

1
CLASSIC AND NOVEL UREMIC TOXINS R Vanholder, University Hospital, Gent, Belgium © 2008 Universitair Ziekenhuis Gent

2
THREE PHYSICO-CHEMICAL TYPES The small water soluble compounds (prototype urea): < 500D The protein-bound compounds (prototype p-cresol) The larger middle molecules (prototype ß 2 -microglobulin): > 500D
: < 500D The protein-bound compounds (prototype p-cresol) The larger middle molecules (prototype ß 2 -microglobulin): > 500D")
3
ADMA AND INTIMA-MEDIA THICKNESS Zoccali et al, JASN, 13, , IMT (mm) (DCCA adjusted) Plasma ADMA (µmol/L) R = 0.31 p = 0.002
 (DCCA adjusted) 0 2 4 6 8 10 12 Plasma ADMA (µmol/L) R = 0.31 p = 0.002")
4
SDMA M. Bode-Böger et al, J Am Soc Nephrol 17: , NOx (nmol/mg protein) SDMA (µM) * * * *
 SDMA (µM) 2 5 10 100 * * * *")
6
*P<0.05 vs blank; **P= vs blank Glorieux et al, KI, 65, , 2004 Monocyte intracellular TNF-a production blank creatine guanidinoacetate guanidinosuccinate methylguanidine ** * * * mean fluorescence intensity GUANIDINES AND LEUKOCYTE FUNCTION

7
COMPARTMENTALISATION GUANIDINES CompoundVEff Rem Urea42.7±6.067±4 Creatine98.0±52.3*42±16* Creatinine54.0±5.9*58±6* Guanidino acetic acid123.8±66.9*37±14* Guanidine89.7±21.4*43±7* Methylguanidine102.6±33.9*42±12* *: p<0.05; V: distribution volume (L); Eff Rem: effective removal (%); Eloot et al, KI, 67, , 2005 Guanidinosuccinic acid Creatinine Methylguanidine Guanidine Urea Guanidinoacetic acid Eloot et al, AJKD, 50, 279, 2007
")
8
CLINICAL IMPACT OF P-CRESOL HR95% CI Comorbidity score Malnutrition (SGA) Free p-cresol Free p-Cresol and outcome A: De Smet et al. Clin Chem 49: , 2003 B: Bammens et al. Kidney Int 64: , 2003 C: Bammens et al. Kidney Int, 69: , 2006 p-Cresol and hospitalisation for infection No infectionsInfections Free p-cresol (µmol/L) Free p-cresol in patients who were (n=16) or were not (n=28) hospitalized because of infection. * P<0.05 A C p-Cresol and uremic symptoms B S tot r = 0.48 P = Total serum p-cresol, mg/L
4.222.15-8.29 Free p-cresol2.281.12-4.64 Free p-Cresol and outcome A: De Smet et al. Clin Chem 49: 470-478, 2003 B: Bammens et al. Kidney Int 64: 2238-2243, 2003 C:")
9
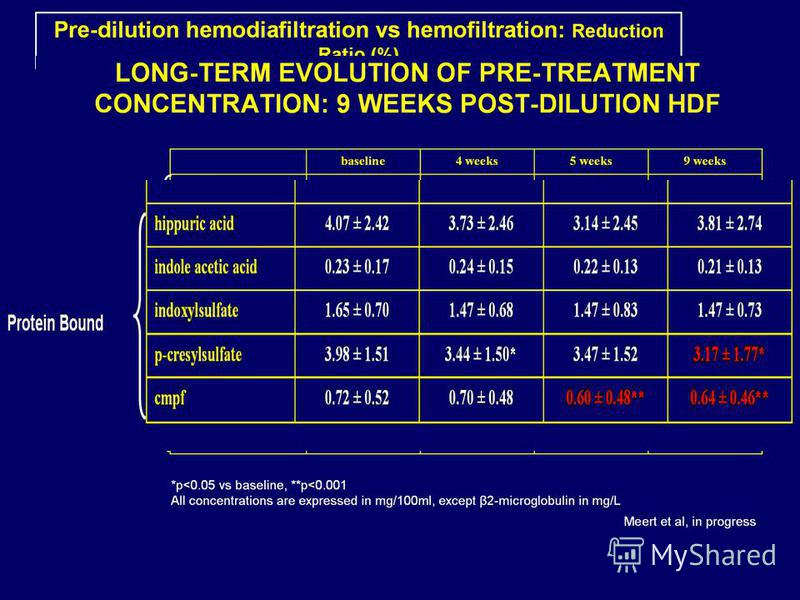
Pcs std Predialysis serum 4.97 mg/dL 3.78 mg/dL Pcs determination in Ghent: RP-HPLC Fluo: Ex265 Em290 Heat P-CRESYLSULFATE Martinez et al, JASN, , 2005 Meert et al, in progress Elution of PCS and p-cresol by HPLC. (A) Elution of synthetic PCS. (B) PCS but not p-cresol is found in predialysis plasma from one of the study patients. (C) Loss of PCS after sulfatase treatment of the same plasma sample with appearance of a new peak. (D) The new peak corresponds to the elution of reagent p-cresol. ABCDABCD Fluorescence time (minutes)
 Elution of synthetic PC")
10
INDOXYL SULFATE Dou et al, Kidney International (2004) 65, 442–451 Homocysteine (N=5) Indoxyl sulfate (N=9) Indole-3-acetic acid (N=4) Hippuric acid (N=6) p-Cresol (N=7) Homocysteine (N=4) Indoxyl sulfate (N=4) Indole-3-acetic acid (N=8) Hippuric acid (N=4) p-Cresol (N=6) *** * Change in endothelial proliferation vs. control, % Change in endothelial proliferation vs. Control with HSA, %
 65, 442–451 Homocysteine (N=5) Indoxyl sulfate (N=9) Indole-3-acetic acid (N=4) Hippuric acid (N=6) p-Cresol (N=7) Homocysteine (N=4) Indoxyl sulfate (N=4) Indole-3-acetic acid (N=8) Hippuric aci")
12
PRE-DIALYSIS β 2 -M VS. OUTCOME – HEMO-STUDY Cheung et al, JASN, 17, , Relative Risk 50 Cumulative mean predialysis serum ß 2 M (mg/L)
")
13
BackgroundPeripheral arterial disease (PAD) is common but commonly unrecognized. Improved recognition of PAD is needed. We used high-throughput proteomic profiling to find PAD-associated biomarkers. Methods and ResultsPlasma was collected from PAD patients (ankle brachial index of 0.90; n45) and subjects with risk factors but without PAD (n43). Plasma was analyzed with surface-enhanced laser desorption/ionization time-of-flight mass spectrometry to quantify 1619 protein peaks. The peak intensity of a 12-kDa protein was higher in PAD patients. Western blot analyses and immunoaffinity studies confirmed that this protein was 2-microglobulin (B2M). In a validation study, B2M was measured by ELISA in plasma in age- and gender-matched PAD (n20) and non-PAD (n20) subjects. Finally, we studied a larger cohort of subjects (n237) referred for coronary angiography but without known PAD. Plasma B2M levels were higher in PAD patients than in non-PAD patients with coronary artery disease. Plasma B2M correlated with ankle brachial index and functional capacity. Independent predictors of PAD were diabetes mellitus, age, and the combination of B2M and C-reactive protein level. ConclusionsIn PAD patients, circulating B2M is elevated and correlates with the severity of disease independent of other risk factors. These findings might provide a needed biomarker for PAD and new insight into its pathophysiology. Further studies in other populations are needed to confirm the utility of measuring B2M in cardiovascular disease risk assessment. A.M. Wilson et al, Circulation. 2007;116: ConclusionsIn PAD patients, circulating B2M is elevated and correlates with the severity of disease independent of other risk factors. These findings might provide a needed biomarker for PAD and new insight into its pathophysiology. Further studies in other populations are needed to confirm the utility of measuring B2M in cardiovascular disease risk assessment.
 is common but commonly unrecognized. Improved recognition of PAD is needed. We used high-throughput proteomic profiling to find PAD-associated biomarkers. Methods and ResultsPlasma was collected from PAD pa")
14
MM WITH BIOLOGICAL POTENTIAL Adrenomedullin AGE Angiogenin AOPP Atrial natriuretic peptide Cholecystokin Clara cell protein Complement factor D Cystatin C Cytokines Delta sleep inducing protein Endothelin -Endorphin Ghrelin Glomerulopressin GIP I GIP II Leptin -Lipotropin Macrophage-colony-stimulating factor Methionine-enkephalin ß 2 -Microglobulin Neuropeptide Y Orexin A Retinol binding protein

17
Genius R Eloot et al, NDT, 2007; 22: Eloot et al, Kidney International 73,

18
CONCLUSIONS Vascular lesions in CKD seem to a large extent related to molecules which are difficult to remove by standard dialysis New strategies are available to enhance removal of these molecules Outcome studies confirm the clinical benefit of removing these compounds

Еще похожие презентации в нашем архиве:


![Genetics Genetics (from Ancient Greek γενετικός genetikos, genitive and that from γένεσις genesis, origin),[1][2][3] a discipline of biology, is the.](/thumbs/17/1180906/big_thumb.jpg "Genetics Genetics (from Ancient Greek γενετικός genetikos, genitive and that from γένεσις genesis, origin),[1][2][3] a discipline of biology, is the.")

 or in revascularization (25.0% candesartan vs. 26.4% standard.")


 water.")


![A New Simple Novel Risk Score for Predicting Bleeding Risk [HAS-BLED] in an Anticoagulated Atrial Fibrillation Cohort: Validation Against Contemporary.](/thumbs/17/1163296/big_thumb.jpg "A New Simple Novel Risk Score for Predicting Bleeding Risk [HAS-BLED] in an Anticoagulated Atrial Fibrillation Cohort: Validation Against Contemporary.")