Скачать презентацию
Идет загрузка презентации. Пожалуйста, подождите

1
Political Atlas of the World: Comprehensive static and dynamic data on 192 states in Approaches to Atlas data visualization Andrei Zinovyev Head of the Team Systems biology and visualization of multimidensional data Bioinformatics Laboratory of Institut Curie (Paris)

2
Political Atlas of the World project (МГИМО, Эксперт, ИОП) STATIC DATA 192 states, 79 indicators 1) Using supervised approach, 5 indices were introduced
 STATIC DATA 192 states, 79 indicators 1) Using supervised approach, 5 indices were introduced")
3
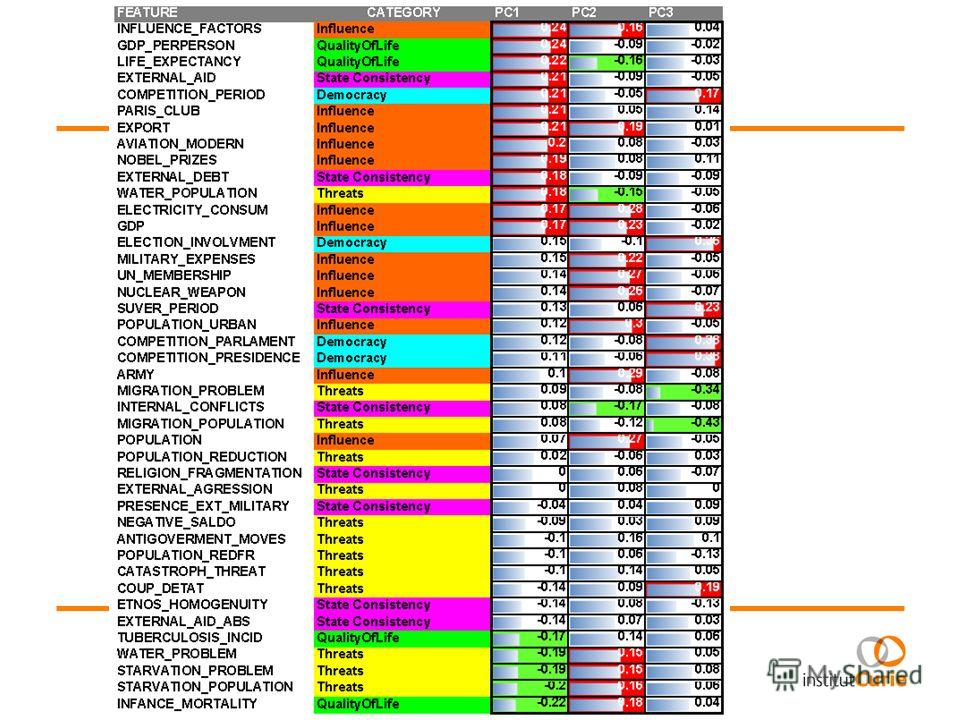
Four principal components of the static index data 1) Threats – vs. – Quality of Life 2) State Consistency – vs. – Democracy 3)State Consistency – vs. – Quality of Life 4)Influence Демократичность Качество жизни Межд.влияние Угрозы Государственность Threats Influence Democracy Quality of Life State Consistency
 Threats – vs. – Quality of Life 2) State Consistency – vs. – Democracy 3)State Consistency – vs. – Quality of Life 4)Influence Демократичность Качество жизни Межд.влияние Угрозы Государственность")
4
Political Atlas of the World project (МГИМО, Эксперт, ИОП) DYNAMIC DATA 192 states, 45 indicators 1)Time series for the period 2)Missing 6,7% of data values 3)Supervised approach is hardly applicable
 DYNAMIC DATA 192 states, 45 indicators 1)Time series for the 1989-2005 period 2)Missing 6,7% of data values 3)Supervised approach is hardly applicable")
5
Outline of the presentation -> Visualization of multidimensional data, brief introduction -> Static analysis: How to visualize the four-dimensional space of the Political Atlas of the World? 1) Visualizing the political globe 2) Method of elastic sphere -> Dynamic analysis: First lessons from time series data 1) A state as a multidimensional trajectory 2) Global trajectory analysis and measure of state successfulness 3) Non-linear Quality of Life index 4) Turning points in the state evolution
 Visualizing the political globe 2) Method of elastic sph")
6
1) Visualization of multidimensional data
 Visualization of multidimensional data")
7
Quantitative data as multidimensional object Table of data Feature 1Feature 2…Feature m Object Object … Object n vector in the space of dimension m n vectors in the space of dimension m

8
December 2007 Graphs and diagrams + 5 more

9
Graphs and diagrams Quality of life State consistency Democracy

10
Multidimensional objects

11
For multidimensional objects it is not possible to visualize all the details – their image depends on the way of projection

12
Shadows of multidimensionality

13
Carl Pearson ( ) and his ideas Linear regression Correlation coefficient Normal distribution Variation properties Method of principal components
 and his ideas Linear regression Correlation coefficient Normal distribution Variation properties Method of principal components")
14
Mean point «Mean» state (minimum 0, maximum 10) = 2,63 (Romania – 2,62, Thailand – 2,66 / Russia – 2,68) = 0.37 (Morocco – 0,35, Denmark – 0,4 / Russia – 2,6) = 3.93 (Vietnam – 3,9, Micronesia - 3,96 / Russia – 4,34) = 4.9 (Santa-Lucia – 4,9, Algeria – 5,01 / Russia – 7,5) = 4.59 (Cambodge – 4,58, Venezuela – 4,63 / Russia – 5,24) Closest to the mean point Quality2,63 2,58 2,712,69 Influence0,37 0,43 0,400,01 Threats3,93 4,23 4,793,39 StateCons4,90 5,01 6,035,03 Democracy4,59 3,64 5,435,02 Algeria Columbia Mean Belize
 = 2,63 (Romania – 2,62, Thailand – 2,66 / Russia – 2,68) = 0.37 (Morocco – 0,35, Denmark – 0,4 / Russia – 2,6) = 3.93 (Vietnam – 3,9, Micronesia - 3,96 / Russia – 4,34) = 4.9 (Santa-Lucia – 4,9, Algeria")
15
Mean point of data is the center of gravity

16
December 2007 First principal component is the line closest to data Maximal dispersion 1 st Principal axis

17
The first principal component of Political Atlas of the World

18
The meaning of the first principal component Life Quality0,53 Influence0,27 Threats-0,48 State Cons0,51 Democracy0,39 unlucky lucky

19
Principal plane is the optimal flat screen for orthogonal projecting of multidimensional data from dimension N to dimension 2 Points in dimension N

20
Principal manifolds (non-linear principal components) To be published in 2009 Principal graphs and manifolds in Handbook on machine learning research Published in 2007
 To be published in 2009 Principal graphs and manifolds in Handbook on machine learning research Published in 2007")
22
How to represent the 4-dimensional space of the Political Atlas of the World? 1) using point colors and sizes
 using point colors and sizes")
23
Component 4 Component Component 1 Component 2

24
How to represent the 4-dimensional space of the Political Atlas of the World? 2) Using properties of 3D-sphere
 Using properties of 3D-sphere")
25
From five indexes to four principal components and three-dimensional sphere Democracy Quality of life Influence Threats Stateness PC1, PC2, PC3, PC4 (PC1) 2 +(PC2) 2 +(PC3) 2 +(PC4) 2 = 1 Three-dimensional sphere in four-dimensional space
 2 +(PC2) 2 +(PC3) 2 +(PC4) 2 = 1 Three-dimensional sphere in four-dimensional space")
26
Strength of Component Population Comp 1 Comp 2 Comp 3

27
Interactive visualization

28
Cluster 2 Losers Cluster 1 Winners Component 1 Component Threats index Cluster analysis : 2 clusters

29
Component 1 Component Capacity for international influence index Cluster analysis : 10 clusters Cluster 1: Big 8 Cluster 2: 53 fed countries Cluster 3: 58 authoritaries Cluster 4: 15 strong non- democracies (1) Cluster 5: 17 strong non- democracies (1) Cluster 6: 22 dependent democracies Cluster 7: 11 countries Cluster 8: India, Ghana, Papua New Guinea Cluster 9: Tonga, Jordan Cluster 10: Columbia, Perou, Salvador
 Cluster 5: 17")
30
Component 1 Component Quality of life index Cluster analysis : 10 clusters Cluster 1: Big 8 Cluster 2: 53 quiet and fed Cluster 3: 58 authoritaries Cluster 4: 15 strong non- democracies (1) Cluster 5: 17 strong non- democracies (1) Cluster 6: 22 dependent democracies Cluster 7: 11 countries Cluster 8: India, Ghana, Papua New Guinea Cluster 9: Tonga, Jordan Cluster 10: Columbia, Perou, Salvador
 Cluster 5: 17 strong non- democraci")
31
Component 1 Component Democracy index Cluster analysis : 10 clusters Cluster 1: Big 8 Cluster 2: 53 fed countries Cluster 3: 58 authoritaries Cluster 4: 15 strong non- democracies (1) Cluster 5: 17 strong non- democracies (1) Cluster 6: 22 dependent democracies Cluster 7: 11 countries Cluster 8: India, Ghana, Papua New Guinea Cluster 9: Tonga, Jordan Cluster 10: Columbia, Perou, Salvador
 Cluster 5: 17 strong non- democracies (1)")
32
Component 1 Component Stateness index Cluster analysis : 10 clusters Cluster 1: Big 8 Cluster 2: 53 fed countries Cluster 3: 58 authoritaries Cluster 4: 15 strong non- democracies (1) Cluster 5: 17 strong non- democracies (1) Cluster 6: 22 dependent democracies Cluster 7: 11 countries Cluster 8: India, Ghana, Papua New Guinea Cluster 9: Tonga, Jordan Cluster 10: Columbia, Perou, Salvador
 Cluster 5: 17 strong non- democracies (1)")
33
How to represent the 4-dimensional space of the Political Atlas of the World? 3) Using elastic sphere
 Using elastic sphere")
35
Dynamic analysis ( ): First lessons from time series data
: First lessons from time series data")
36
GDP_PER_PERSON MIGRATION_POPULATION MILITARY_EXPENSES ARMY EXPORT GDP STATE AS MULTIDIMENSIONAL TRAJECTORY FRANCE Projection into 3 principal components

37
GDP_PER_PERSON MIGRATION_POPULATION MILITARY_EXPENSES ARMY LIFE_EXPECTANCY GDP_PER_PERSON STATE AS MULTIDIMENSIONAL TRAJECTORY RUSSIA

38
GERMANY BELGIUM USA RWANDA

39
Topic 1. Global trends in multidimensional trajectories of states What are the most general trends in the trajectories direction?

40
PC1 PC2

41
PC1 PC3

43
Successfulness index? «Successfulness» Number of states 1000 millions humans + China in 1995

44
HDI 2005 Successfulness 2005 China USA India Russia

45
Successfulness spectrum

46
Post-USSR Successfulness BRIC 10 most successful Bad dynamics Successfulness

47
Stably successful Rapidly growing Stable middle countries Stably unsuccessful Degrading Slope of the linear trend of successfulness «Successfulness» for 1998

48
Topic 2. Non-linear index of quality of life How to combine 4 features into one in the most objective way? 1)GROSS PRODUCT PER PERSON 2)LIFE SPAN EXPECTATION 3)INFANCE MORTALITY 4)TUBERCULOSIS INCIDENCE
GROSS PRODUCT PER PERSON 2)LIFE SPAN EXPECTATION 3)INFANCE MORTALITY 4)TUBERCULOSIS INCIDENCE")
49
Principal curve Quality of Life = -1 Quality of Life =

50
Quality of Life rank Quality of Life index

51
December 2007 Kazakhstans problems: high GDP PER PERSON and high TUBERCULOSIS INCIDENCE and INFANCE_MORTALITY Non-linear quality of life index Indicator values in 2005, relative to mean-values

52
Topic 3. Turning points on the multidimensional trajectories When a state history is mostly affected by some (internal or external) factors?
 factors?")
53
Position along the curve Bending Turning points RUSSIA in the

54
Position along the curve Bending (-0.27)INFANCE_MORTALITY (-0.22)COMPETITION_PRESIDENCE (-0.18)EXTERNAL_AID_ABS (0.5)GDP (0.43)GDP_PERPERSON (0.4)EXPORT (0.26)COMPETITION_PRESIDENCE (0.26)COUP_DETAT (-0.26)POPULATION (-0.26)MILITARY_EXPENSES (-0.26)ELECTRICITY_CONSUM (-0.23)ARMY (-0.23)POPULATION_REDFR (0.26)ANTIGOVERMENT_MOVES (0.26)POPULATION_REDUCTION (0.25)ELECTION_INVOLVMENT (0.24)COMPETITION_PARLAMENT (-0.26)MILITARY_EXPENSES (-0.24)ELECTRICITY_CONSUM (-0.24)INTERNAL_CONFLICTS
INFANCE_MORTALITY (-0.22)COMPETITION_PRESIDENCE (-0.18)EXTERNAL_AID_ABS (0.5)GDP (0.43)GDP_PERPERSON (0.4)EXPORT 1 2 3 4 (0.26)COMPETITION_PRESIDENCE (0.26)COUP_DETAT (-0.26)POPULATION (-0.26)MILITARY_EXPENSES")
55
GERMANY in (-0.31)COMPETITION_PRESIDENCE (-0.31)COMPETITION_PARLAMENT (0.31)GDP (0.36)POPULATION_URBAN (-0.1)POPULATION_REDFR (-0.09)MILITARY_EXPENSES (0.42)COMPETITION_PARLAMENT (0.42)COMPETITION_PRESIDENCE (0.43)POPULATION_REDUCTION
COMPETITION_PRESIDENCE (-0.31)COMPETITION_PARLAMENT (0.31)GDP (0.36)POPULATION_URBAN (-0.1)POPULATION_REDFR (-0.09)MILITARY_EXPENSES (0.42)COMPETITION_PARLAMENT (0.42)COMPETITION_PRESIDENCE (0.43)POPULATION_REDUCTION")
56
BELGIUM in (0.32)ELECTRICITY_CONSUM (-0.41)TUBERCULOSIS_INCID (-0.31)MIGRATION_POPULATION (0.36)EXPORT (0.37)POPULATION_REDFR (0.43)GDP (-0.36)ARMY (-0.35)MILITARY_EXPENSES
ELECTRICITY_CONSUM (-0.41)TUBERCULOSIS_INCID (-0.31)MIGRATION_POPULATION (0.36)EXPORT (0.37)POPULATION_REDFR (0.43)GDP (-0.36)ARMY (-0.35)MILITARY_EXPENSES")
57
Topic 4. Verhulst local models

58
Predict the future from today and the past X t+1 = F(X t, X t-1, X t-2, …) Simplest models (predictions): 1) X t+1 = A = const (tomorrow is the same as today) 2) X t+1 = X t +A (additive improvement or degrading – linear trend) 3) X t+1 = A·X t (proportional improvement – exponential growth/decline) All of them are trivial (linear) The simplest non-trivial (non-linear) model 4) X t+1 = X t +A·X t ·(X t -K) – Verhulsts model Leads to several possible solutions (saturation, exponential, periodic, chaotic)
 Simplest models (predictions): 1) X t+1 = A = const (tomorrow is the same as today) 2) X t+1 = X t +A (additive improvement or degrading – linear trend) 3) X t+1 = A·X t (prop")
59
Исходный временной ряд Initial time series В 1985 г. делается прогноз на основе значений трех лет ( ) о том, что к 2030г. ИЧР выйдет на (значение K). Однако, уже в 1990 рост ИЧР опережает прогноз (играет роль какой-то внешний фактор) In 1985 one makes a prognosis based on the HDI values during the last three years ( ) about that towards 2030 HDI will gradually achieve (K value). However, already in 1990 HDI becomes higher than predicted (some external factor plays a role). В 1990г. прогноз уточняется с использованием периода Предсказывается неограниченный экспоненциальный рост (а
 о том, что к 2030г. ИЧР выйдет на 0.925 (значение K). Однако, уже в 1990 рост ИЧР опережает прогноз (играет роль какой-то внешний фактор) In")
60
В 1995г. прогноз качественно остается прежним – экспоненциальный рост с чуть меньшими темпами (значение a). Однако, в 2000г. этот прогноз оказывается слишком оптимистичен (какой-то внешний фактор резко ограничивает рост). In 1995 the prognosis qualitatively remains the same: exponential growth with slightly slower speed (a value). However, in 2000 this prognosis happens to be too optimistic (some external factor now limits the growth) В 2000г. на основе периода ( ) прогнозируется быстрая (значение а) стагнация к значению ИЧР (значение K). Однако, даже этот прогноз к 2005г. оказывается слишком оптимистичен. In 2000 based on the ( ) period one predicts rapid (a value) stagnation to the HDI values (K value). However, even this prognosis happens to be too optimistic towards В 2005г. прогноз корректируется: далее предсказывается полная стагнация со значением ИЧР в (достигнут предел роста) In 2005 the prognosis is corrected: further one predicts complete stagnation with HDI value (growth limit has been reached).
. Однако, в 2000г. этот прогноз оказывается слишком оптимистичен (какой-то внешний фактор резко ограничивает рост). In 1995 the prognosis qualit")
61
K (значение ниши) а (нормированное усилие) ХАОС ЭКСПОНЕНЦИАЛЬНЫЙ РОСТ (или ПАДЕНИЕ) СТАГНАЦИЯ ДОЛГОСРОЧНЫЙ РОСТ? ЛИНЕЙНЫЙ РОСТ? КОЛЕБАНИЯ
 а (нормированное усилие) 00.692123 -2 0 2.8 2 1 0.5 -0.5 -2 -3 ХАОС ЭКСПОНЕНЦИАЛЬНЫЙ РОСТ (или ПАДЕНИЕ) СТАГНАЦИЯ ДОЛГОСРОЧНЫЙ РОСТ? ЛИНЕЙНЫЙ РОСТ? КОЛЕБАНИЯ")
62
ЛИНЕЙНЫЙ РОСТ? ХАОС K (значение ниши) а (нормированное усилие) ЭКСПОНЕНЦИАЛЬНЫЙ РОСТ (или ПАДЕНИЕ) КОЛЕБАНИЯ
 а (нормированное усилие) 00.692123 -2 0 2.8 2 1 0.5 -0.5 -2 -3 ЭКСПОНЕНЦИАЛЬНЫЙ РОСТ (или ПАДЕНИЕ) КОЛЕБАНИЯ")
63
ЛИНЕЙНЫЙ РОСТ? ХАОС K (значение ниши) а (нормированное усилие) ЭКСПОНЕНЦИАЛЬНЫЙ РОСТ (или ПАДЕНИЕ) СТАГНАЦИЯ КОЛЕБАНИЯ ГОД 1985
 а (нормированное усилие) 00.692123 -2 0 2.8 2 1 0.5 -0.5 -2 -3 ЭКСПОНЕНЦИАЛЬНЫЙ РОСТ (или ПАДЕНИЕ) СТАГНАЦИЯ КОЛЕБАНИЯ ГОД 1985")
64
ЛИНЕЙНЫЙ РОСТ? ХАОС K (значение ниши) а (нормированное усилие) ЭКСПОНЕНЦИАЛЬНЫЙ РОСТ (или ПАДЕНИЕ) СТАГНАЦИЯ КОЛЕБАНИЯ ГОД 1990
 а (нормированное усилие) 00.692123 -2 0 2.8 2 1 0.5 -0.5 -2 -3 ЭКСПОНЕНЦИАЛЬНЫЙ РОСТ (или ПАДЕНИЕ) СТАГНАЦИЯ КОЛЕБАНИЯ ГОД 1990")
65
ЛИНЕЙНЫЙ РОСТ? ХАОС K (значение ниши) а (нормированное усилие) ЭКСПОНЕНЦИАЛЬНЫЙ РОСТ (или ПАДЕНИЕ) СТАГНАЦИЯ КОЛЕБАНИЯ ГОД 1995
 а (нормированное усилие) 00.692123 -2 0 2.8 2 1 0.5 -0.5 -2 -3 ЭКСПОНЕНЦИАЛЬНЫЙ РОСТ (или ПАДЕНИЕ) СТАГНАЦИЯ КОЛЕБАНИЯ ГОД 1995")
Еще похожие презентации в нашем архиве: