Скачать презентацию
Идет загрузка презентации. Пожалуйста, подождите

1
АНАЛИЗ VLTI ФОТОМЕТРИЧЕСКИХ ДАННЫХ, ДЛЯ ОПРЕДЕЛЕНИЯ ПАРАМЕТРОВ ДАННЫХ, ДЛЯ ОПРЕДЕЛЕНИЯ ПАРАМЕТРОВ АТМОСФЕРЫ В ОБСЕРВАТОРИИ ESO АТМОСФЕРЫ В ОБСЕРВАТОРИИ ESO Христофорова Мария Кафедра Астрономии, КГУ

5
VINCI I(t) DIMM S(t), FWHM ACV S(t)calculated PS Polynomialapproximation
 DIMM S(t), FWHM ACV S(t)calculated PS Polynomialapproximation")
6
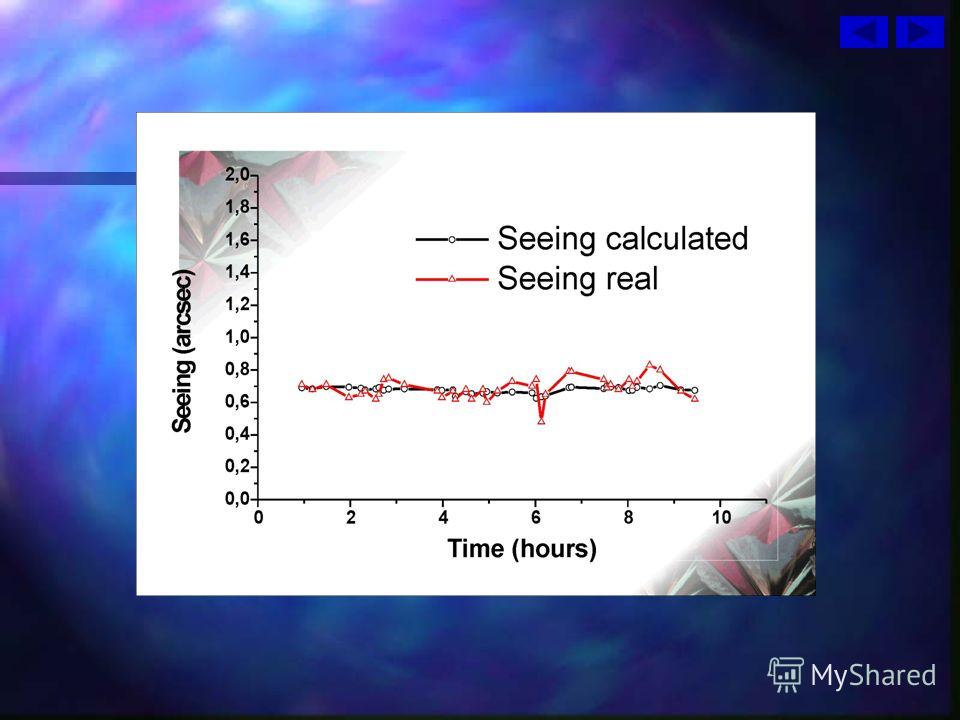
Vndrs_Data Reduction Reads VINCI raw FITS files and makes processing Exphotres Extracts photometric data Acvres Calculates the autocovariance Fftres Calculates power spectra Intfull Creates tables with ACV for 4 time delays, seeing Plots Makes plots of calculated and measured seeing Group Makes plots of ACV, PS, Intensity distribution ( photometric data) Fitting Determines a polynomial ACVand calculates seeing from ACV data approximation to seeing of

13
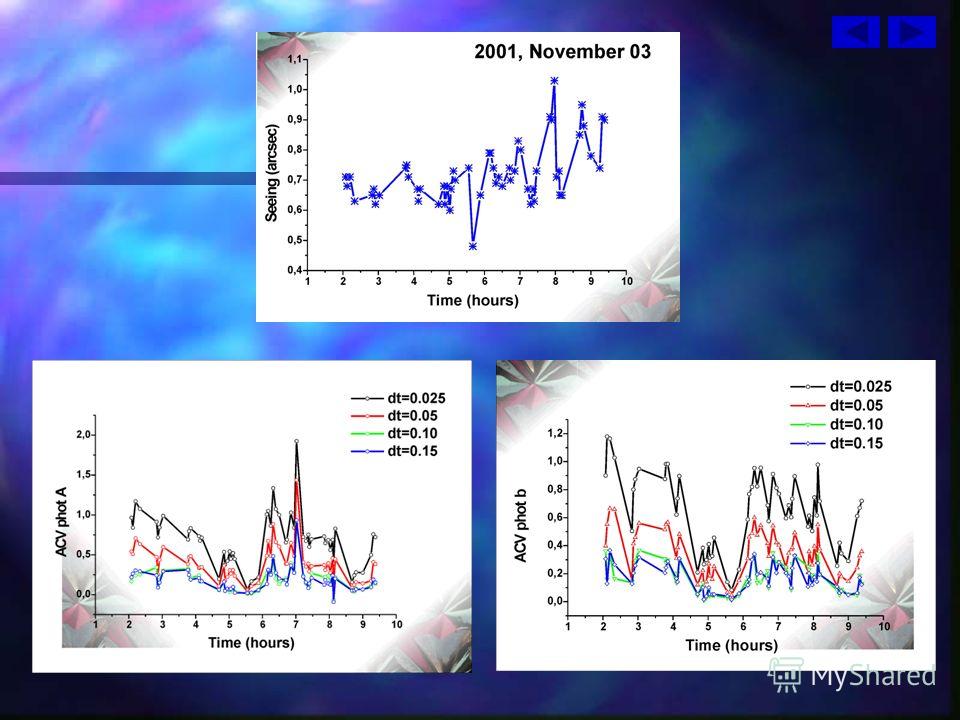
CONCLUSIONS Moments of good seeing correlate with moments of high intensity variance, while periods of poor seeing are accompanied by low variance. Moments of good seeing correlate with moments of high intensity variance, while periods of poor seeing are accompanied by low variance. This effect depends on the aperture of the telescopes and baseline. This effect depends on the aperture of the telescopes and baseline. Seeing can be predicted from scintillation at least at a first approximation

Еще похожие презентации в нашем архиве:


 Substitution Least.")


 UID 0 identifies root User accounts normally start at UID 500 Users'")